- 98% of all eCommerce apparel on sale – reports
According to the DataFeedWatch report and Statista.com report from 2022 – apparel takes the lead in both the number of products on sale and purchase value per visit in global eCommerce
Fashion wins “on sale” statistic
Over 26% of all products advertised across paid channels like Google ads, Facebook, Instagram, Youtube, Twitter, Pinterest, etc. are on sale – we read from “Feed Marketing Report 2022” created by DataFeedWatch by Cart.com – a leading data feed management solution. The data has been generated in the first half of 2022 from over 15,000 online stores across 60+ countries.
Discounting has always been used by merchants, and for many reasons: to increase sales, to clear old stock, to gain new customers or retain current ones. Stalling economies, fears of recession, and growing inflation translates into customers being cautious and price sensitive to a much bigger extent than before. Hence, we can expect greater discounts from most merchants in the coming holiday season.
Apparel & accessories dominate the “on sale” statistics in the Feed Marketing Report 2022, with 36.98% of products being discounted. The leading subcategory is shoes, with an astonishing 42.81% of products on sale.
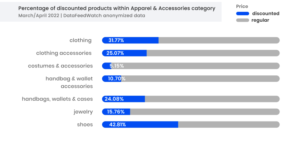
Health & beauty products follow shortly with 33.12% and Furniture just behind with 32.77%.
Home & garden, with its 25.62% of discounted products, has long been considered one of the most active inventories on sale. This year they are slightly below the global average of 26.49%.
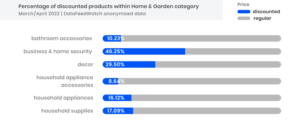

Hardware and Animal & pet supplies also sit below the global discounted average, with 26.12% and 24.03% respectively.
Among the least discounted sectors are Media with 2.86% and Software with 9.53%.
“Price sensitivity among shoppers in the second half of 2022 is very apparent and we see merchants, digital agencies, and online stores utilizing price-based strategies in their paid campaigns well before the holiday season”, says Jacques van der Wilt, General Manager Feed Marketing at Cart.com.
Apparel best in “spend-per-visit” statistic
Alongside being the most discounted category, Apparel also holds the highest shopper spend-per-visit worldwide for the same period. The report shows luxury apparel shoppers spend $3.12 on average, with general and active apparel shoppers spending $2.65 per visit.
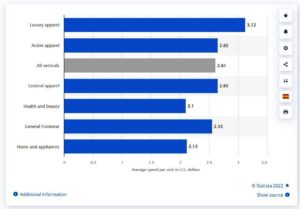
Apparel is followed by Home & appliances, with an average spend of $2.12 and Health & beauty, with $2.1.
According to Statista.com, in the second quarter of 2022, online shoppers spent an average of just over 2.6 U.S. dollars per visit across all verticals.
With Black Friday, Cyber Monday, and Boxing Day still ahead of us we can expect fierce competition based on discounts, especially across apparel products, health & beauty, and furniture. It’s good news for customers who are always keen on greater discounts.
What records can we expect from the coming months? Will Apparel surpass the 40% discount mark? Will the global average increase to 30%? We have to wait to see, but the holiday season of 2022 will be very interesting to watch.
Sources:
Full Feed Marketing Report 2022:
https://www.datafeedwatch.com/feed-marketing-report
Statista report: Average e-commerce spending per online shopper worldwide per visit as of 2nd quarter 2022, by category
COVER IMAGE: Eonline.com

